2018 is this year going to reveal what we all have feared?
With so many natural disasters with in the past few years taxing FEMA’s piggy bank, what happens when its all gone?
What will America do when FEMA is broke? Do you have home owners insurance or renters insurance to cover your damages?
Just to name a few places. Texas, Hawaii, Louisiana, Florida, New York, New Jersey, East Coast, West Coast fires and Mudslides, Earth Quakes, Extended weather, unusual tornadoes and hurricane seasons are becoming more familiar everyday.
FEMA’s Budget 13.9 Billion dollars has been set aside for 2018
We are only into 6 months of the year and the balance left is $21 million at the end of May 2018. That does not include Hawaii’s Volcano Eruption.
U.S. Billion-Dollar Weather & Climate Disasters 2013-2018
- Drought
- Flooding
- Freeze
- Severe Storm
- Tropical Cyclone
- Wildfire
- Winter Storm
2018
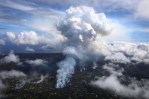
Hawaii Volcano Kilauea Eruption
May 3, 2018
Still continues to erupt lava, As of 6-15-2018 there are 700+ structures destroyed. They have no idea how many more will be lost as the lava continues with no stopping in site.
Total Estimated Costs
TBD
Southeastern Severe Storms
March 2018
A potent severe storm system caused over 20 tornadoes across Alabama and also widespread hail damage from Texas to Florida. This system also created significant late-season snowfall and across many Eastern and Northeastern states.
Total Estimated Costs
TBD
3 Deaths
Northeast Winter Storm
March 2018
Powerful Nor’easter impacted Northeastern states MD, MA, NH, NJ, NY, PA, CT, DE, RA and VA. Damage due to high winds, heavy snow and heavy coastal erosion.
Total Estimated Costs
$1.8 Billion
9 Deaths
Central and Eastern Winter Storm
January 2018
A Nor’easter caused damage across many Northeastern states including MA, NJ, NY, CT, ME, NH, PA, MD, RI, SC, TN, VA, NC and GA.
Total Estimated Costs
$1.0 Billion
22 Deaths
2017
Western Wildfires, California Firestorm
Summer-Fall 2017
A historic firestorm damages or destroys over 15,000 homes, businesses and other structures across California in October. The combined destruction of the Tubbs, Atlas, Nuns and Redwood Valley wildfires represent the most costly wildfire event on record, also causing 44 deaths. Extreme wildfire conditions in early December also burned hundreds of homes in Los Angeles. Numerous other wildfires across many western and northwestern states burn over 9.8 million acres exceeding the 10-year annual average of 6.5 million acres. Montana in particular was affected by wildfires that burned in excess of 1 million acres. These wildfire conditions were enhanced by the preceding drought conditions in several states.
Total Estimated Costs
$18.0 ($18.2) Billion
54 Deaths
North Dakota, South Dakota and Montana Drought
Spring-Fall 2017
Extreme drought causes extensive impacts to agriculture in North Dakota, South Dakota and Montana. Field crops including wheat were severely damaged and the lack of feed for cattle forced ranchers to sell off livestock. This drought has also contributed to the increased potential for severe wildfires.
Total Estimated Costs
$2.5 Billion
0 Deaths
Hurricane Maria
September 2017
Category 4 hurricane made landfall in southeast Puerto Rico after striking the U.S. Virgin Island of St. Croix.
Maria’s high winds caused widespread devastation to Puerto Rico’s transportation, agriculture, communication and energy infrastructure. Extreme rainfall up to 37 inches caused widespread flooding and mudslides across the island. The interruption to commerce and standard living conditions will be sustained for a long period, as much of Puerto Rico’s infrastructure is rebuilt. Maria tied Hurricane Wilma (2005) for the most rapid intensification, strengthening from tropical depression to a category 5 storm in 54 hours. Maria’s landfall at Category 4 strength gives the U.S. a record three Category 4+ landfalls this year (Maria, Harvey, and Irma). A reanalysis on the number of deaths due to Maria is being conducted and will be updated in the coming months.
Total Estimated Costs
$90.0 ($90.9) Billion
65 Deaths
Hurricane Irma
September 2017
Category 4 hurricane made landfall at Cudjoe Key, Florida after devastating the U.S. Virgin Islands – St John and St Thomas – as a category 5 storm. The Florida Keys were heavily impacted, as 25% of buildings were destroyed while 65% were significantly damaged. Severe wind and storm surge damage also occurred along the coasts of Florida and South Carolina. Jacksonville, FL and Charleston, SC received near-historic levels of storm surge causing significant coastal flooding. Irma maintained a maximum sustained wind of 185 mph for 37 hours, the longest in the satellite era. Irma also was a category 5 storm for longer than all other Atlantic hurricanes except Ivan in 2004.
Total Estimated
Costs
$50.0 ($50.5) Billion
97 Deaths
Hurricane Harvey
August 2017
Category 4 hurricane made landfall near Rockport, Texas causing widespread damage. Harvey’s devastation
was most pronounced due to the large region of extreme rainfall producing historic flooding across Houston and surrounding areas. More than 30 inches of rainfall fell on 6.9 million people, while 1.25 million experienced over 45 inches and 11,000 had over 50 inches, based on 7-day rainfall totals ending August 31. This historic U.S. rainfall caused massive flooding that displaced over 30,000 people and damaged or destroyed over 200,000 homes and businesses.
Total Estimated Costs
$125.0 ($126.3) Billion
89 Deaths
Midwest Severe Weather
June 2017
Severe hail and high wind damage impacting Nebraska, Illinois and Iowa. More than one dozen tornadoes
touched down across parts of Iowa, in addition to other storm damage.
Total Estimated Costs
$1.4 Billion
0 Deaths
Midwest Severe Weather
June 2017
Severe hail, high winds and numerous tornadoes impact many states over several days including WY, TX, NE, KS, MO, IA, IL, PA, VA, NY.
Total Estimated Costs
$1.5 ($1.6) Billion
0 Deaths
Minnesota Hail Storm and Upper Midwest Severe Weather
June 2017
Severe hail and high winds cause considerable damage across Minnesota and Wisconsin. The Minneapolis metro area in particular was damaged from large, destructive hail impacting many buildings and vehicles. This damage is comparable to the May 15, 1998 Minnesota hail storm that was also very costly.
Total Estimated Costs
$2.4 Billion
0 Deaths
Colorado Hail Storm and Central Severe Weather
May 2017
Hail storm and wind damage impacting several states including CO, OK, TX, NM, MO. The most costly impacts were in the Denver metro region where baseball-sized hail caused the most expensive hail storm in Colorado history, with insured losses exceeding 2.2 (2.3) billion.
Total Estimated Costs
$3.4 ($3.5) Billion
0 Deaths
Missouri and Arkansas Flooding and Central Severe Weather
May 2017
A period of heavy rainfall up to 15 inches over a multi-state region in the Midwest caused historic levels of flooding along many rivers. The flooding was most severe in Missouri, Arkansas and southern Illinois where levees were breached and towns were flooded. There was widespread damage to homes, businesses, infrastructure and agriculture. Severe storms also caused additional impacts during the flooding event across a number of central and southern states.
Total Estimated Costs
$1.7 Billion
20 Deaths
South/Southeast Severe Weather
March 2017
Large hail and high winds in Texas north of the Dallas metro region caused widespread damage to structures and vehicles. Severe storms also caused damage across several other states (OK, TN, KY, MS, AL) due to the combination of high winds, hail and tornadoes.
Total Estimated Costs
$2.7 ($2.8) Billion
0 Deaths
Southeast Freeze
March 2017
Severe freeze heavily damaged fruit crops across several southeastern states (SC, GA, NC, TN, AL, MS, FL, KY, VA). Mid-March freezes are not climatologically unusual in the Southeast, however many crops were blooming 3+ weeks early due to unusually warm temperatures during the preceding weeks. Damage was most severe in Georgia and South Carolina. Crops most impacted include peaches, blueberries, strawberries and apples, among others.
Total Estimated Costs
$1.0 Billion
0 Deaths
Midwest Tornado Outbreak
March 2017
Tornado outbreak and wind damage across many Midwestern states (AR, IA, IL, KS, MI, MN, MO, NE, NY, OH, WI). Missouri and Illinois were impacted by numerous tornadoes while Michigan and New York were affected by destructive, straight-line winds following the storm system. Nearly one million customers lost power in Michigan alone due to sustained high winds, which affected several states from Illinois to New York.
Total Estimated Costs
$2.2 Billion
2 Deaths
Central/Southeast Tornado Outbreak
March 2017
Over 70 tornadoes developed during a widespread outbreak across many central and southern states causing significant damage. There was also widespread straight-line wind and hail damage. This was the second largest tornado outbreak to occur early in 2017.
Total Estimated Costs
$1.8 ($1.9) Billion
6 Deaths
California Flooding
February 2017
Heavy, persistent rainfall across northern and central California created substantial property and infrastructure damage from flooding, landslides and erosion. Notable impacts include severe damage to the Oroville Dam spillway, which caused a multi-day evacuation of 188,000 residents downstream. Excessive rainfall also caused flood damage in the city of San Jose, as Coyote Creek overflowed its banks and inundated neighborhoods forcing 14,000 residents to evacuate.
Total Estimated Costs
$1.5 Billion
5 Deaths
Southern Tornado Outbreak and Western Storms
January 2017
High wind damage occurred across southern California near San Diego followed by 79 confirmed tornadoes during an outbreak across many southern states including AL, FL, GA, LA, MS, SC and TX. This was the 3rd most tornadoes to occur in a single outbreak during a winter month (Dec.-Feb.) for records going back to 1950.
Total Estimated Costs
$1.1 Billion
24 Deaths
2016
Western/Southeast Wildfires
Summer-Fall 2016
Western and Southern states experienced an active wildfire season with over 5.0 million acres burned nationally. Most notable was the firestorm that impacted Gatlinburg, Tennessee with hurricane-force wind gusts in extremely dry conditions creating volatile wildfire behavior. These wildfires destroyed nearly 2,500 structures and caused 14 fatalities. The drought conditions in many areas of the Southeast and California worsened the wildfire potential.
Total Estimated Costs
$2.4 ($2.5) Billion
21 Deaths
West/Northeast/Southeast Drought
2016
California’s 5-year drought persisted during 2016 while new areas of extreme drought developed in states across the Northeast and Southeast. The long-term impacts of the drought in California have damaged forests where 100+ million trees have perished and are a public safety hazard. The agricultural impacts were reduced in California as water prices and crop fallowing declined. However, agricultural impacts developed in Northeast and Southeast due to stressed water supplies.
Total Estimated Costs
$3.5 ($3.6) Billion
0 Deaths
Hurricane Matthew
October 2016
Hurricane Matthew paralleled the Southeast coast from Florida to North Carolina causing widespread damage from wind, storm surge and inland flooding. The most costly impacts were due to historic levels of river flooding in eastern North Carolina where 100,000 homes, businesses and other structures were damaged. This inland flooding was comparable to Hurricane Floyd (1999) that also impacted
eastern North Carolina. Matthew narrowly missed landfall on Florida’s east coast as a powerful category 4 storm.
Total Estimated Costs
$10.0 ($10.5) Billion
49 Deaths
Louisiana Flooding
August 2016
A historic flood devastated a large area of southern Louisiana resulting from 20 to 30 inches of rainfall over several days. Watson, Louisiana received an astounding 31.39 inches of rain from the storm. Two-day rainfall totals in the hardest hit areas have a 0.2% chance of occurring in any given year: a 1 in 500 year event. More than 30,000 people were rescued from the floodwaters that damaged or destroyed over 50,000 homes, 100,000 vehicles and 20,000 businesses. This is the most damaging U.S. flood event since Superstorm Sandy impacted the Northeast in 2012.
Total Estimated Costs
$10.0 ($10.5) Billion
13 Deaths
Rockies and Northeast Severe Weather
July 2016
Severe storms across the Rockies and Northeastern states (CO, WY, VA, MD, PA, NJ, NY) caused large hail and high wind damage. Storm damage in Colorado was the most costly due to hail.
Total Estimated Costs
$1.5 Billion
0 Deaths
West Virginia Flooding and Ohio Valley Tornadoes
June 2016
Torrential rainfall caused destructive flooding through many West Virginia towns, damaging thousands of homes and businesses and causing considerable loss of life. Over 1,500 roads and bridges were damaged or destroyed making the impact on infrastructure comparable to the historic 2013 Colorado flood. The storm system also produced numerous tornadoes causing damage across several Ohio Valley states.
Total Estimated Costs
$1.0 Billion
23 Deaths
Rockies/Central Tornadoes and Severe Weather
May 2016
Sustained period of severe thunderstorms and tornadoes affecting several states including Montana, Colorado, Kansas, Missouri and Texas. The most concentrated days for tornado development were on May 22 and 24. Additional damage was created by straight-line high wind and hail damage.
Total Estimated Costs
$1.1 ($1.2) Billion
0 Deaths
Plains Tornadoes and Central Severe Weather
May 2016
Tornadoes and severe storms cause widespread damage across the Plains and Central states (NE, MO, TX, OK, KS, CO, IL, KY, TN) over a multi-day period. The damage from tornadoes and high wind was most costly in Nebraska and Missouri.
Total Estimated Costs
$1.7 ($1.8) Billion
2 Deaths
South/Southeast Tornadoes
April 2016
Large outbreak of tornadoes affects numerous states across the South and Southeast. Additional damage also from large hail and straight-line wind during the multi-day thunderstorm event.
Total Estimated Costs
$2.4 ($2.5) Billion
6 Deaths
Houston Flooding
April 2016
A period of extreme rainfall up to 17 inches created widespread urban flooding in Houston and surrounding suburbs. Thousands of homes and businesses were damaged and more than 1,800 high water rescues were conducted. This represents the most widespread flooding event to affect Houston since Tropical Storm Allison in 2001.
Total Estimated Costs
$2.7 ($2.8) Billion
8 Deaths
North/Central Texas Hail Storm
April 2016
Widespread severe hail damage across north and central Texas including the cities of Plano, Wylie, Frisco, Allen and San Antonio. The damage in San Antonio was particularly severe as the National Weather Service verified reports of hail size reaching 4.5 inches in diameter. This ranks as one of the most costly hail events to affect the United States.
Total Estimated Costs
$3.5 ($3.7) Billion
0 Deaths
North Texas Hail Storm
March 2016
Large hail and strong winds caused considerable damage in heavily populated areas of north Texas. This damage was most notable in the cities of Dallas, Fort Worth and Plano.
Total Estimated Costs
$2.1 ($2.2) Billion
0 Deaths
Southern Severe Weather
March 2016
Severe hail impacts the Fort Worth and Arlington metro region in Texas. Additional large hail and high wind damage occurred in other locations of Texas, Louisiana and Mississippi.
Total Estimated Costs
$1.2 ($1.3) Billion
1 Death
Texas and Louisiana Flooding
March 2016
Multiple days of heavy rainfall averaging 15 to 20 inches led to widespread flooding along the Sabine River basin on the Texas and Louisiana border. This prompted numerous evacuations, high-water rescues and destruction, as more than 1,000 homes and businesses were damaged or destroyed.
Total Estimated Costs
$2.3 ($2.4) Billion
5 Deaths
Southeast and Eastern Tornadoes
February 2016
Early outbreak of tornadoes and severe weather across many southern and eastern states including (AL, CT, FL, GA, LA, MA, MD, MS, NC, NJ, NY, PA, SC, TX, VA). There were at least 50 confirmed tornadoes causing widespread damage.
Total Estimated Costs
$1.0 ($1.1) Billion
10 Deaths
2015
Western Drought
2015
Drought conditions were present across numerous western states (CA, NV, OR, WA, ID, MT, UT, AZ) with the most severe conditions continuing to plague California for all of 2015. The agriculture sector was again impacted by a lack of rainfall resulting in hundreds of
thousands of acres of farmland remaining fallow and requiring excess groundwater pumping to irrigate existing agriculture interests. Wildfire conditions were further enhanced by the ongoing drought. California experienced extensive damage from both drought and wildfire impacts. Drought conditions did improve dramatically across Texas and Oklahoma, in the form of several major flood events.
Total Estimated Costs
$4.5 ($4.8) Billion
0 Deaths
Texas Tornadoes and Midwest Flooding
December 2015
A powerful storm system packing unseasonably strong tornadoes caused widespread destruction in the Dallas metropolitan region, damaging well over 1,000 homes and businesses. This same potent system also produced intense rainfall over several Midwestern states triggering historic flooding that has approached or broken records at river gauges in several states (MO, IL, AR, TN, MS, LA). The flooding has over topped levees and caused damage in numerous areas. This historic storm also produced high wind, snow and ice impacts from New Mexico through the Midwest and into New England. Overall, the storm caused at least 50 deaths from the combined impact of tornadoes, flooding and winter weather.
Total Estimated Costs
$2.0 ($2.1) Billion
50 Deaths
Western and Alaskan Wildfires
Summer-Fall 2015
Wildfires burned over 10.1 million acres across the U.S. in 2015, surpassing 2006 for the highest annual total of U.S. acreage burned since record-keeping began in 1960. The most costly wildfires occurred in California where over 2,500 structures were destroyed due to the Valley and Butte wildfires with the insured losses alone exceeding 1.0 (1.1) billion. The most extensive wildfires occurred in Alaska where over 5 million acres burned within the state. There was extensive burnt acreage across other western states, most notably (OR, WA, ID, MT, ND, CO, WY, TX).
Total Estimated Costs
$3.0 ($3.2) Billion
12 Deaths
South Carolina and East Coast Flooding
October 2015
Historic levels of flooding impacted South Carolina causing widespread damage to many homes, businesses, public buildings and infrastructure. This interrupted commerce and closed major transportation corridors (such as I-95) for weeks as rivers slowly receded. Locally extreme rainfall totals exceeding 20-inches were common resulting from the convergence of a powerful low pressure system / frontal boundary and copious moisture from Hurricane Joaquin in the Atlantic.
Total Estimated Costs
$2.0 ($2.1) Billion
25 Deaths
Central and Northeast Severe Weather
June 2015
Severe storms across numerous Central and Northeast states (CO, CT, IA, IL, MD, MI, NJ, NY, PA, SD, VA, WI) with widespread hail and high wind damage.
Total Estimated Costs
$1.2 ($1.3) Billion
1 Death
Texas and Oklahoma Flooding and Severe Weather
May 2015
A slow-moving system caused tremendous rainfall and subsequent flooding to occur in Texas and Oklahoma. The Blanco river in Texas swelled from 5 feet to a crest of more than 40 feet over several hours causing considerable property damage and loss of life. The city of Houston also experienced flooding which resulted in hundreds of high-water rescues. The damage in Texas alone exceeded 1.0 (1.1) billion. There was also damage in other states (KS, CO, AR, OH, LA, GA, SC) from associated severe storms.
Total Estimated Costs
$2.5 ($2.7) Billion
31 Deaths
Southern Plains Tornadoes
May 2015
Tornado outbreak across the Southern Plain states (IA, KS, NE, OK, CO, SD, TX) with 122 tornadoes. The most costly damage occurred across Texas and Oklahoma.
Total Estimated Costs
$1.3 ($1.4) Billion
4 Deaths
South/Southeast Severe Weather
April 2015
Severe storms across the South and Southeastern states (AL, AR, FL, GA, KS, LA, MS, NC, OK, SC, TN, TX). High winds and severe hail created the most significant damage in Texas.
Total Estimated Costs
$1.3 ($1.4) Billion
0 Deaths
Midwest/Ohio Valley Severe Weather
April 2015
Severe storms across the Midwest and Ohio Valley including the states (AR, IA, IL, IN, KS, KY, MI, MO, NC, OH, OK, PA, TN, TX, WI, WV). Large hail and high winds created the most damage across Missouri and Illinois.
Total Estimated Costs
$1.6 ($1.7) Billion
2 Deaths
Central and Eastern Winter storm, Cold Wave
February 2015
A large winter storm and associated cold wave impacted many central, eastern and northeastern states (CT, DE, GA, IL, KY, MA, MD, ME, MI, NC, NH, NJ, NY, OH, PA, RI, SC, TN, VA). The city of Boston was particularly impacted as feet of snow continued to accumulate causing load-stress on buildings and clogging transportation corridors. Total, direct losses in Massachusetts alone exceed 1.0 (1.1) billion for this event, with considerable damage in many other states.
Total Estimated Costs
$3.0 ($3.2) Billion
30 Deaths
2014
Western Drought
2014
Historic drought conditions affected the majority of California for all of 2014 making it the worst drought on record for the state. Surrounding states and parts of Texas, Oklahoma and Kansas also experienced continued severe drought conditions. This is a continuation of
drought conditions that have persisted for several years.
Total Estimated Costs
$4.0 ($4.2) Billion
0 Deaths
Rockies/Plains Severe Weather
September 2014
Severe storms across the Rockies and Plains states (CO, KS, TX). Large hail and high winds created significant damage across eastern Colorado and Texas, particularly in the Dallas metro area.
Total Estimated Costs
$1.4 ($1.5) Billion
0 Deaths
Michigan and Northeast Flooding
August 2014
Heavy rainfall in excess of 5 inches caused significant flooding in cities across Michigan damaging thousands of cars, business, homes and other infrastructure. Flooding also occurred across Maryland and New York’s Long Island, as the slow-moving storm system delivered 24-hour rainfall exceeding 6 and 12 inches, respectively, creating more flood damage. Islip, NY received 13.57 inches of rain over a 24-hour period on Aug 12-13 setting a new 24-hour precipitation record for New York.
Total Estimated Costs
$1.0 ($1.1) Billion
2 Deaths
Rockies/Central Plains Severe Weather
June 2014
Severe storms across the Rockies and Central Plains states (NE, KS, WY, IA, AR). Wind gusts exceeding 90 mph and baseball to softball sized hail caused severe damage to structures and vehicles in central and eastern Nebraska.
Total
Estimated Costs
$1.9 ($2.0) Billion
2 Deaths
Rockies/Midwest/Eastern Severe Weather
May 2014
Severe storms across the Rockies, Midwest and Eastern states (CO, MT, IA, IL, IN, OH, SC, VA, PA, DE, NY) with the most costly damage in Colorado, Illinois and Pennsylvania.
Total Estimated Costs
$3.7 ($3.9) Billion
0 Deaths
Midwest/Southeast/Northeast Tornadoes and Flooding
April 2014
Tornado outbreak across the Midwest, Southeast and Northeast states
(AL, AR, DE, FL, GA, KS, MD, MO, MS, NC, NJ, NY, PA, TN, VA) with 83 confirmed tornadoes. Mississippi had its 3rd greatest number of tornadoes reported for any day since 1950. Torrential rainfall in the Florida panhandle also caused major flooding, as Pensacola set new 1-day and 2-day precipitation records of 15.55 and 20.47 inches, respectively. Flooding rains were also reported in coastal Alabama, as Mobile received 11.24 inches of rain, the third greatest calendar day rainfall total for the city.
Total Estimated Costs
$1.7 ($1.8) Billion
33 Deaths
Plains Severe Weather
April 2014
Severe storms across the Plains states (IL, KS, MO, TX) causing considerable hail and wind damage in Texas.
Total Estimated Costs
$1.4 ($1.5) Billion
0 Deaths
Midwest/Southeast/Northeast Winter Storm
January 2014
Winter storm caused widespread damage across numerous Midwest, Southeast and Northeastern states (AL, GA, IL, IN, KY, MD, MI, MO, MS, NC, NJ, NY, OH, PA, SC, TN, VA).
Total Estimated Costs
$2.2 ($2.3) Billion
16 Deaths
2013
Western/Plains Drought/Heatwave
Spring-Fall 2013
The 2013 drought slowly dissipated from the historic levels of the 2012 drought, as conditions improved across many Midwestern and Plains states. However, moderate to extreme drought did remain or expand into western states (AZ, CA, CO, IA, ID, IL, KS, MI, MN, MO, ND, NE, NM, NV, OK, OR, SD, TX, UT, WA, WI, WY). In comparison to 2011 and 2012 drought conditions the US experienced only moderate crop losses across the central agriculture states.
Total Estimated Costs
$10.4 ($11.3) Billion
53 Deaths
Ohio Valley Tornadoes
November 2013
Late-season outbreak of tornadoes and severe weather over the Ohio Valley (IL, IN, KY, MI, MO, OH) with 70 confirmed tornadoes. Most severe impacts occurred across Illinois and Indiana.
Total Estimated Costs
$1.1 ($1.2) Billion
8 Deaths
Colorado Flooding
September 2013
A stalled frontal boundary over Colorado led to record rainfall, as some areas received > 15 inches over several days. This resulted in historic flooding across numerous cities and towns. Destruction of residences, businesses and transportation infrastructure was widespread.
Total Estimated Costs
$1.5 ($1.6) Billion
9 Deaths
Midwest Severe Weather
August 2013
Severe weather and large hail causes considerable damage across Minnesota and Wisconsin.
Total Estimated Costs
$1.0 ($1.1) Billion
0 Deaths
Midwest/Plains/Northeast Tornadoes
May 2013
Outbreak of tornadoes and severe weather over the Midwest, Plains and Northeast (IL, IN, KS, MO, NY, OK, TX) with 92 confirmed tornadoes including the deadly tornado that struck El Reno, OK. There was also significant damage resulting from hail and straight-line wind.
Total Estimated Costs
$1.8 ($2.0) Billion
10 Deaths
Midwest/Plains/East Tornadoes
May 2013
Outbreak of tornadoes and severe weather over the Midwest, Plains and Eastern states (GA, IA, IL, KS, MO, NY, OK, TX) with 59 confirmed tornadoes including the deadly tornado that impacted Moore, OK. Many destructive tornadoes remained on the ground for an extended time.
Total Estimated Costs
$2.4 ($2.6) Billion
27 Deaths
Illinois Flooding and Severe Weather
April 2013
A slow-moving storm system created rainfall totals of 5 to 10 inches across northern and central Illinois including the Chicago metro. This resulted in damage to many homes and businesses. There was also severe weather damage from wind and hail across Indiana and Missouri.
Total Estimated Costs
$1.1 ($1.2) Billion
4 Deaths
Midwest/Plains Severe Weather
April 2013
Severe weather across the Midwest and Plains states (IN, KS, MO, NE) with a total of 26 confirmed tornadoes. Considerable damage resulting from hail and straight-line wind.
Total Estimated Costs
$1.4 ($1.6) Billion
1 Death
Southeast Severe Weather
March 2013
Severe weather over the Southeast (MS, AL, GA, TN) with 10 confirmed tornadoes. Considerable damage resulting from large hail and straight-line wind.
Total Estimated Costs
$2.0 ($2.2) Billion
1 Death